Working with Dashboards
Working with Dashboards
Univonix Migration dashboards allow you to effectively manage and monitor the progress of your migration planning and publishing by providing a real time 'snap shot' of the current state of your work.
The dashboards have a logical three level hierarchy starting at the Source level:
Level 1. Batches Overview Dashboard showing a breakdown of all the batches in the Source and high level statistics for those batches. You then drill down within a specific
batch.
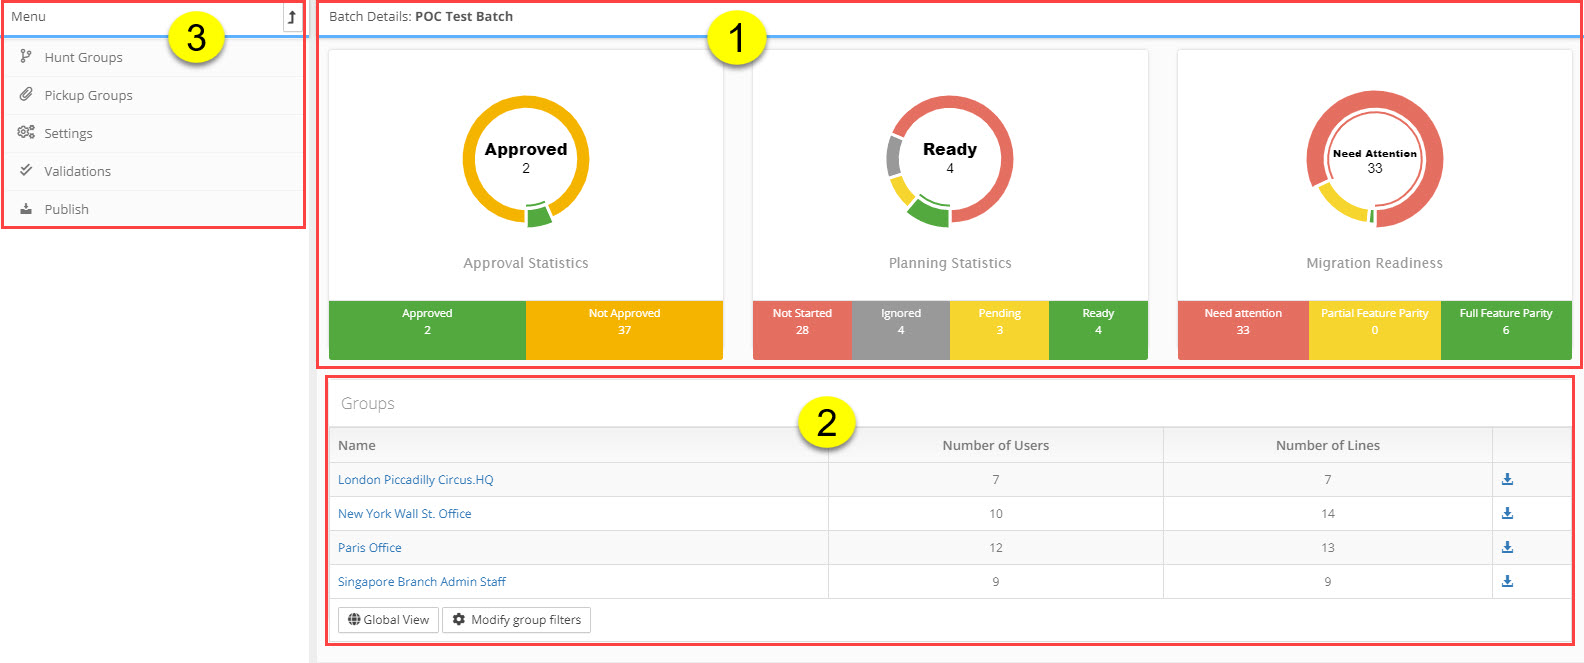
Level 2. Batch Details Dashboard provides a breakdown of all the groups that make up that batch and more granular details on your migration planing progress for the batch.
You continue to drill down into a specific group to the...
Level 3. Group Details Dashboard provides a breakdown on the status of every user and device in that group and all feature parity issues for those users and devices.
Dashboards are broken into 3 work areas:
1. Charts: provide a graphical snap shot of work progress for the dashboard level you are currently viewing.
Charts are interactive, you can scroll over the chart to highlight (bring forward) the relevant data.
2. Table Results: in the table you will see additional details that are specific to the dashboard level you are at, so for example in the Batches Details dashboard you will see in
the table a breakdown of all the groups in that batch. The table provides tools to take additional actions per result line, like updating details or exporting data.
3. Menu: the menu options change at each dashboard level. The menu provides access to additional functionality that is relevant for the elements in that dashboard.